# Point Annotations
Point annotations are used to mark points on the chart area. This can be useful for highlighting values that are of interest.
# Configuration
# Point annotation specific options
The following options are available for point annotations.
| Name | Type | Scriptable | Default |
|---|---|---|---|
backgroundShadowColor | Color | Yes | 'transparent' |
borderWidth | number | Yes | 1 |
pointStyle | PointStyle | Yes | 'circle' |
radius | number | Yes | 10 |
rotation | number | Yes | 0 |
xAdjust | number | Yes | 0 |
xValue | number | string | Yes | undefined |
yAdjust | number | Yes | 0 |
yValue | number | string | Yes | undefined |
# Common options to all annotations
The following options are available for all annotations.
| Name | Type | Scriptable | Default |
|---|---|---|---|
adjustScaleRange | boolean | Yes | true |
backgroundColor | Color | Yes | options.color |
borderColor | Color | Yes | options.color |
borderDash | number[] | Yes | [] |
borderDashOffset | number | Yes | 0 |
borderShadowColor | Color | Yes | 'transparent' |
display | boolean | Yes | true |
drawTime | string | Yes | 'afterDatasetsDraw' |
init | boolean | See initial animation | undefined |
id | string | No | undefined |
shadowBlur | number | Yes | 0 |
shadowOffsetX | number | Yes | 0 |
shadowOffsetY | number | Yes | 0 |
xMax | number | string | Yes | undefined |
xMin | number | string | Yes | undefined |
xScaleID | string | Yes | undefined |
yMin | number | string | Yes | undefined |
yMax | number | string | Yes | undefined |
yScaleID | string | Yes | undefined |
z | number | Yes | 0 |
# General
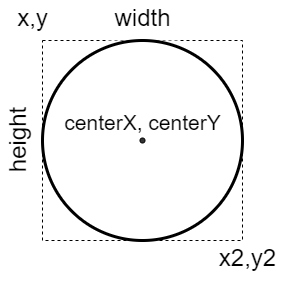
If one of the axes does not match an axis in the chart, the point annotation will take the center of the chart as point. The 2 coordinates, xValue, yValue are optional. If not specified, the point annotation will take the center of the scale dimension as point.
The 4 coordinates, xMin, xMax, yMin, yMax are optional. If not specified, the box is expanded out to the edges in the respective direction and the box size is used to calculated the center of the point. To enable to use the box positioning, the radius must be set to 0 or NaN.
| Name | Description |
|---|---|
adjustScaleRange | Should the scale range be adjusted if this annotation is out of range. |
display | Whether or not this annotation is visible. |
drawTime | See drawTime. |
id | Identifies a unique id for the annotation and it will be stored in the element context. When the annotations are defined by an object, the id is automatically set using the key used to store the annotations in the object. When the annotations are configured by an array, the id, passed by this option in the annotation, will be used. |
radius | Size of the point in pixels. |
rotation | Rotation of point, in degrees. |
xAdjust | Adjustment along x-axis (left-right) of point relative to computed position. Negative values move the point left, positive right. |
xMax | Right edge of the box in units along the x axis. |
xMin | Left edge of the box in units along the x axis. |
xScaleID | ID of the X scale to bind onto. If missing, the plugin will try to use the scale of the chart, configured as 'x' axis. If more than one scale has been defined in the chart as 'x' axis, the option is mandatory to select the right scale. |
xValue | X coordinate of the point in units along the x axis. |
yAdjust | Adjustment along y-axis (top-bottom) of point relative to computed position. Negative values move the point up, positive down. |
yMax | Bottom edge of the box in units along the y axis. |
yMin | Top edge of the box in units along the y axis. |
yScaleID | ID of the Y scale to bind onto. If missing, the plugin will try to use the scale of the chart, configured as 'y' axis. If more than one scale has been defined in the chart as 'y' axis, the option is mandatory to select the right scale. |
yValue | Y coordinate of the point in units along the y axis. |
z | The z property determines the drawing stack level of the point annotation element. All visible elements will be drawn in ascending order of z option, with the same drawTime option. |
# Styling
| Name | Description |
|---|---|
backgroundColor | Fill color. |
backgroundShadowColor | The color of shadow. See MDN (opens new window). |
borderColor | Stroke color. |
borderDash | Length and spacing of dashes. See MDN (opens new window). |
borderDashOffset | Offset for line dashes. See MDN (opens new window). |
borderShadowColor | The color of border shadow. See MDN (opens new window). |
borderWidth | Stroke width. |
pointStyle | Style of the point. |
shadowBlur | The amount of blur applied to shadow. See MDN (opens new window). |
shadowOffsetX | The distance that shadow will be offset horizontally. See MDN (opens new window). |
shadowOffsetY | The distance that shadow will be offset vertically. See MDN (opens new window). |
# Element
The following diagram is showing the element properties about a 'point' annotation: