# 2.x Migration Guide
chartjs-plugin-annotation plugin version 2 introduces a number of breaking changes. In order to improve performance, offer new features, and improve maintainability, it was necessary to break backwards compatibility, but we aimed to do so only when worth the benefit.
# Chart.js version
The annotation plugin requires at least version 3.7.0 to work because of some bug fixes that happened within chart.js itself.
# Options
A number of changes were made to the configuration options passed to the plugin configuration. Those changes are documented below.
xScaleIDoption default has been changed, now set toundefined. If the option is missing, the plugin will try to use the first scale of the chart, configured as'x'axis. If more than one scale has been defined in the chart as'x'axis, the option is mandatory to select the right scale.yScaleIDoption default has been changed, now set toundefined. If the option is missing, the plugin will try to use the first scale of the chart, configured as'y'axis. If more than one scale has been defined in the chart as'y'axis, the option is mandatory to select the right scale.- When stacked scales (opens new window) are used, instead of the whole chart area, the designated scale area is used as fallback for
xMin,xMax,yMin,yMax,xValueoryValueoptions. positionfor the label of the line annotation changes the behavior whenstartorendis set, and when the line annotation location is defined byxMin,xMax,yMin, andyMaxoptions.- in the previous version 1.x, if the
positionwas set tostartorend, it was calculated using chart area dimension (whenstartusingtoporleft, whenendusingbottomorright). - in version 2.x, if the
positionis set tostart, it is the point where the line starts being drawn, and when set toend, it is the point where the line ends drawing. ThexMin,xMax,yMin, andyMaxoptions are not related to the chart area anymore but are related to the values sequence (and their order) on the associated scale.
- in the previous version 1.x, if the
cornerRadiusoption was replaced byborderRadiusin the box annotation configuration and in the label configuration of line annotation to align with Chart.js options.xPaddingandyPaddingoptions were merged into a singlepaddingobject in the label configuration of line annotation to align with Chart.js options.enabledoption was replaced bydisplayin the callout configuration of label annotation, in the label configuration of line and box annotations and in the arrow heads configuration of line annotation to have the same option on all elements.dblClickSpeedoption was removed from the plugin options becausedblclickevent hook is not available anymore.drawTimeoption at top level plugin configuration is moved to newcommonobject in the plugin annotation options, which contains options to apply to all annotations:
plugins: {
  annotation: {
    common: {
      drawTime: 'afterDraw'
    },
    annotations: [
      ...
    ]
  }
}
# Elements
In chartjs-plugin-annotation plugin version 2 the label of box and line annotations is a sub-element. This has changed how to access to the label options. Now the label options are at element.label.options. The following example shows how to show and hide the label when the mouse is hovering the box:
type: 'box', // or 'line'
enter: function({element}) {
  element.label.options.display = true;
  return true;
},
leave: function({element}) {
  element.label.options.display = false;
  return true;
},
chartjs-plugin-annotation plugin version 2 removes the clipping of the label to the box annotation size.
chartjs-plugin-annotation plugin version 2 hides the following methods in the line annotation element because they should be used only internally:
intersectsisOnLabel
chartjs-plugin-annotation plugin version 2 normalizes the properties of the annotation elements in order to be based on common box model.
# Box annotation
The following diagram is showing the element properties about a 'box' annotation:
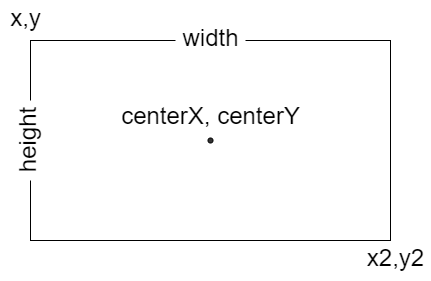
The label of a box annotation is described as a label annotation and accessible by element.label.
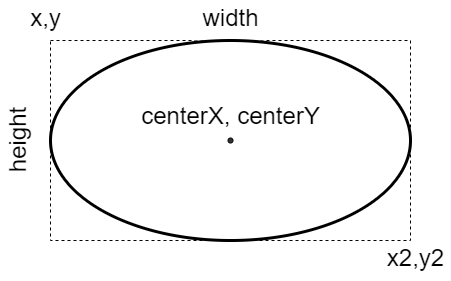
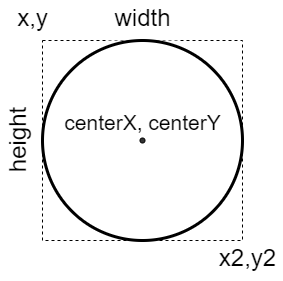
# Ellipse annotation
The following diagram is showing the element properties about a 'ellipse' annotation:
# Label annotation
The following diagram is showing the element properties about a 'label' annotation:

# Line annotation
The following diagram is showing the element properties about a 'line' annotation:
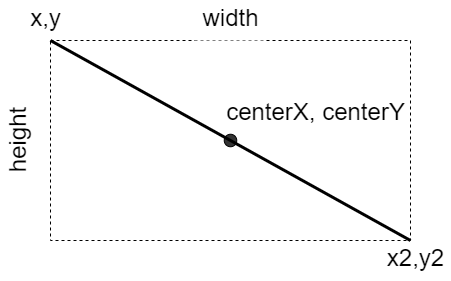
The label of a line annotation is described as a label annotation and accessible by element.label.
# Point annotation
The following diagram is showing the element properties about a 'point' annotation:
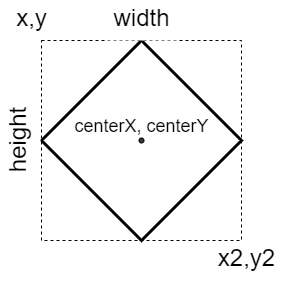
# Polygon annotation
The following diagram is showing the element properties about a 'polygon' annotation:
# Events
chartjs-plugin-annotation plugin version 2 introduces the interaction options, to configure which events trigger annotation interactions. By default, the plugin uses the chart interaction configuration (opens new window).
- When scatter charts (opens new window) are used, the interaction default
modein Chart.js ispoint, while, in the previous plugin version, the default wasnearest.
The dblclick event hook was removed from annotations options because, being executed asynchronously, it can not enable the chart re-rendering, automatically after processing the event completely. This is important when the user requires re-draws. It gets slow and messy if every event hook does the draw (or update!).
# Types
chartjs-plugin-annotation plugin version 2 removes the compatibility with TypeScript versions less than 4.1 which is the minimum supported one.