Chart.js
Simple yet flexible JavaScript charting library for the modern web
New in 4.0 Colors plugin
Default palette of Chart.js brand colors is available as a built-in time-saving zero-configuration plugin.
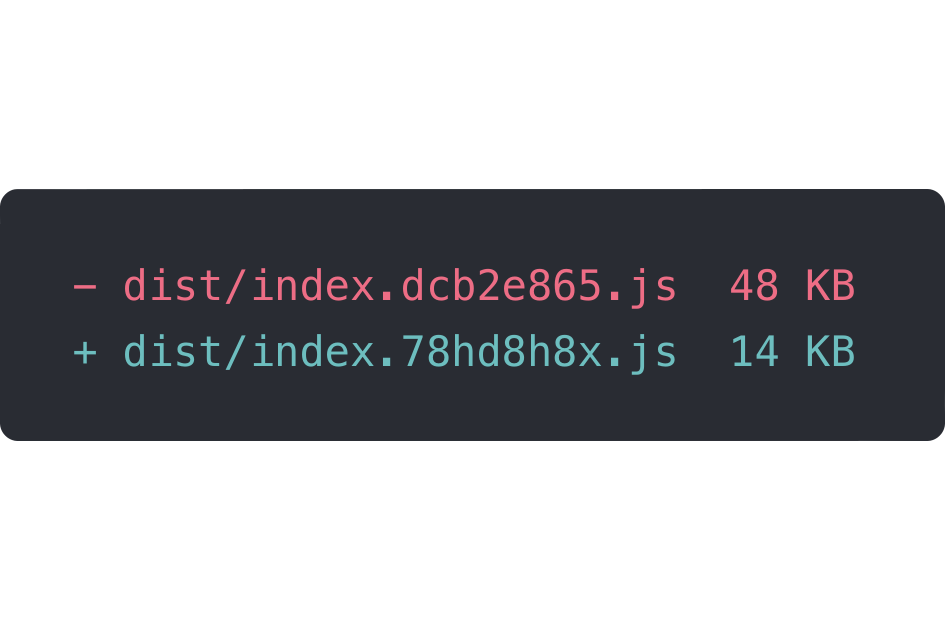
New in 4.0 Tree-shaking
JavaScript bundle size can be reduced by dozens of kilobytes by registering only necessary components.
New in 3.5 Scale stacking
Layout boxes can be stacked and weighted in groups.
New in 3.4 Subtitle plugin
A secondary title plugin with all the same options as main title.
New in 3.1 Line segment styling
Line segments can be styled by any user defined criteria.
New in 3.0 Advanced animations
Transitions of every property in every element can be configured individually and independently.
New in 3.0 Performance!
Numerous performance enhancements have been introduced. This example has 1M (2x500k) points with the new decimation plugin enabled.
New in 2.0 Mixed chart types
Mix and match bar and line charts to provide a clear visual distinction between datasets.
New in 2.0 New chart axis types
Plot complex, sparse datasets on date time, logarithmic or even entirely custom scales with ease.
New in 2.0 Animate everything!
Out of the box stunning transitions when changing data, updating colours and adding datasets.

Open source
Chart.js is a community maintained project, contributions welcome!

8 Chart types
Visualize your data in 8 different ways; each of them animated and customisable.
HTML5 Canvas
Great rendering performance across all modern browsers (IE11+).

Responsive
Redraws charts on window resize for perfect scale granularity.